
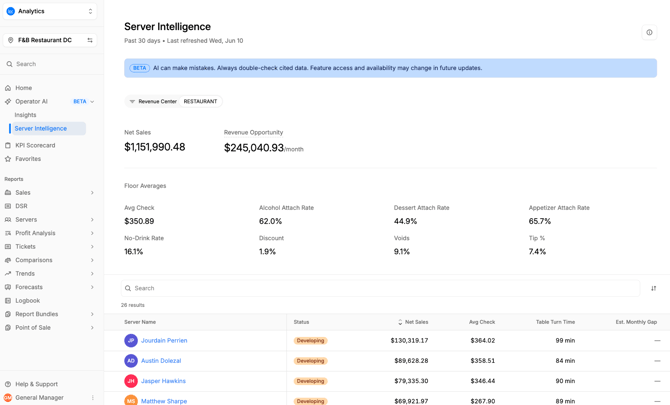
Server Intelligence is an AI-powered page in Analytics that shows how each of your servers perform across the metrics that drive sales and guest experience — average check, attach rates, table turn time, tips, voids, and more — and benchmarks every server against your floor average.
Why it matters: It turns server performance into a clear, comparable picture and quantifies revenue or margin increase which might otherwise be left uncaptured. By showing exactly where each server lags the floor — and pairing it with AI coaching notes — Server Intelligence tells you who to coach, what to coach on, and how much it’s worth, making one-on-ones and floor coaching far more targeted.
BETA: Server Intelligence is a beta feature. AI can make mistakes, so always double-check cited data before acting. Feature access and availability may change in future updates.
How to access Server Intelligence
- From the Analytics platform, find the Operator AI section in the left sidebar (marked with a BETA badge) and select Server Intelligence.
Note: Server Intelligence must be enabled for your store, and your user must have the “View Operator AI” permission. If you don’t see the page, contact your account administrator.
What you'll see
Job code navigation
The top of the Server Intelligence page uses tabs to compartmentalize employees by role, based on Job Code information provided via your POS integration. This boundary ensures that insights are based on apples-to-apples comparisons, avoiding comparisons like alcohol attach rate across job codes such as bartender vs server.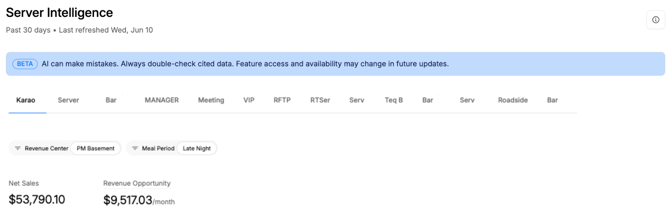
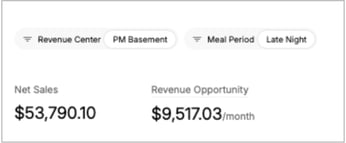
Revenue Center and Meal Period filters
Directly beneath the job code navigation tabs are filters for Revenue Center and Meal Period. All stats beneath these filters - summary metrics, floor benchmarks, and the server table - update to reflect the filters selected.
The division of performance stats by revenue center and meal period further ensure that benchmark comparisons are an accurate portrayal of a server's performance with conditional relevance intact, and that any derived insights provide valuable coaching moments, instead of time consuming red-herrings.
Summary metrics
Just below the Revenue Center and Meal Period filters, two headline numbers frame the opportunity:
- Total Monthly Sales — your store’s total server-driven sales for the period.
- Revenue Opportunity — the estimated additional monthly revenue your store could generate if every server matched your top performers. Hover the tooltip to see how it’s calculated.
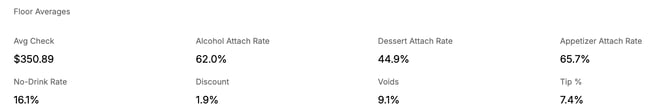
Floor benchmarks
Two rows of benchmark stat lines show the floor averages for each metric — Avg Check, Alcohol / Dessert / Appetizer Attach Rates, No-Drink Rate, Discount, Voids, and Tip % — the baseline
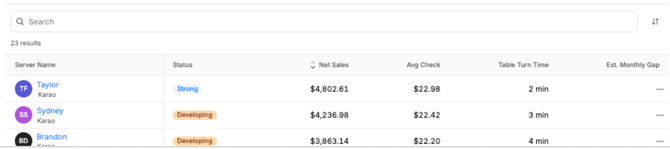
Server table
Each server is listed with their key metrics:
- Server Name — clicking this element opens the Server Details drawer.
- Status — a performance score with a color-coded badge (blue = strong, orange = developing, red = needs attention).
- Net Sales, Avg Check, Table Turn Time — the server’s net sales, average check, and average table turn time.
- Est. Monthly Gap — the estimated revenue gap between this server and the floor’s best performers.
The table is sorted by Net Sales, by default, and can be searched by server name.
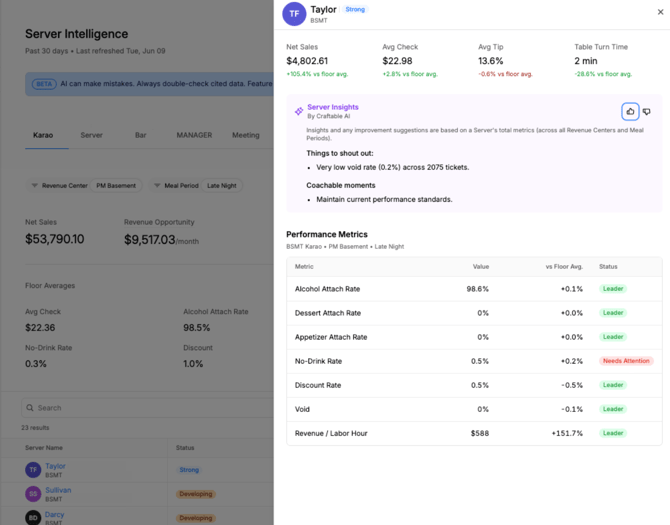
Server details (click-through drawer)
Clicking a server’s name opens a detail drawer that slides in from the right side of the screen, giving you a complete performance profile for that individual without leaving the page.
Inside the drawer you'll find:
- Header — the server’s name, role, and performance score badge.
- KPI cards — Net Sales, Avg Check, Avg Tip, and Table Turn Time — each shown with how it compares to the floor average.
- Server Insights by Craftable AI — AI-generated coaching that splits into “Things to shout out” (strengths to recognize) and “Coachable moments” (areas to improve). Use the thumbs-up / thumbs-down buttons to rate the insight.
Note: information & suggestions in the Server Insights info-banner is based on aggregate level metrics (across all revenue centers and meal periods).
- Performance Metrics — a metrics comparison table with the server’s correlating stats, the correlating floor average, and a status rating (Leader = at or above floor avg, Needs Improvement = below floor avg) for the selected Revenue Center and Meal Period.
Callouts
- POS data which does not have both an assigned Revenue Center and Meal Period will not populate to Server Intelligence.
- Server Intelligence is meant to surface individuals' coachable attributes, areas of improvement, and notable accomplishments – it is not a replacement for the holistic view of business health represented in Reports.
Tips
- Use the Revenue Opportunity figure and Est. Monthly Gap column to prioritize who to coach first.
- Filter by daypart before a shift to coach servers in the context they’re actually working.
- Bring the “Things to shout out” notes into one-on-ones — recognition is as valuable as correction.
- Use the feedback buttons to help the AI sharpen its coaching over time.