Variance Summary Report
The Variance Summary Report allows you to see your variances by Category over a selected Period or Date Range. Refer to the steps below on how to view the Variance Summary Report.
Viewing Variance Summary Report
- Click Reports > Reports List from the navigation.
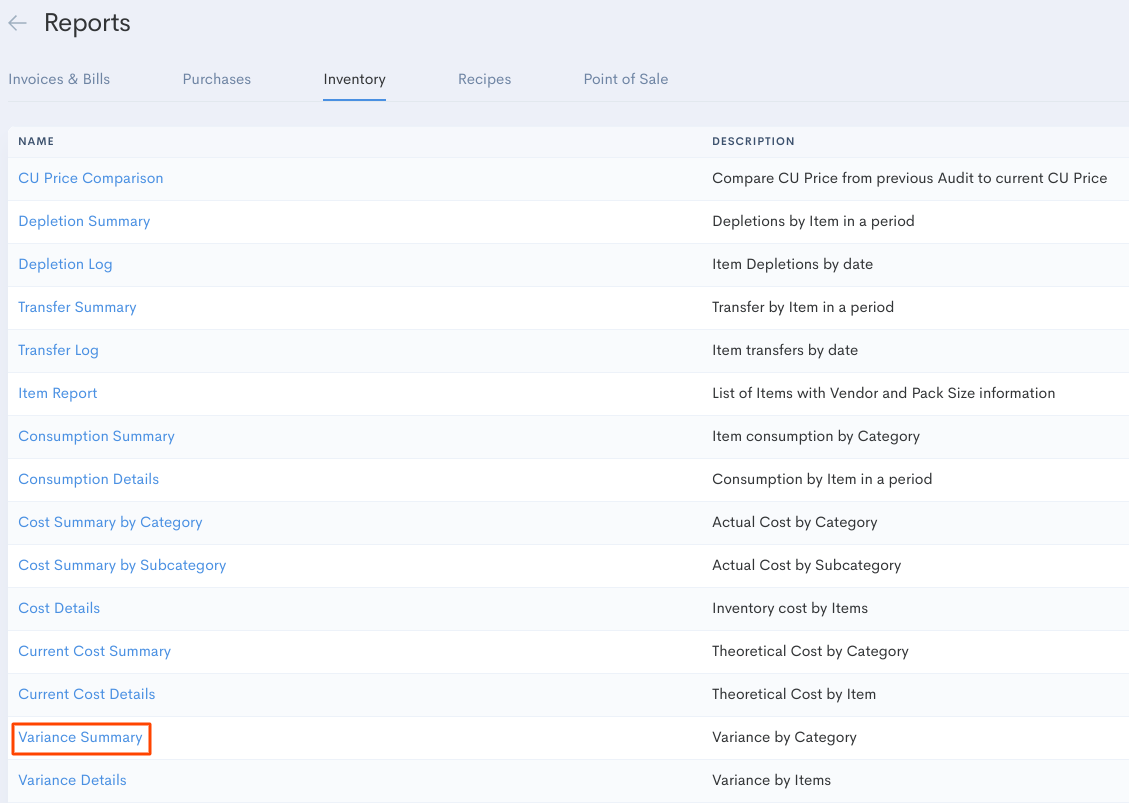
- Click Variance Summary under the Inventory heading.
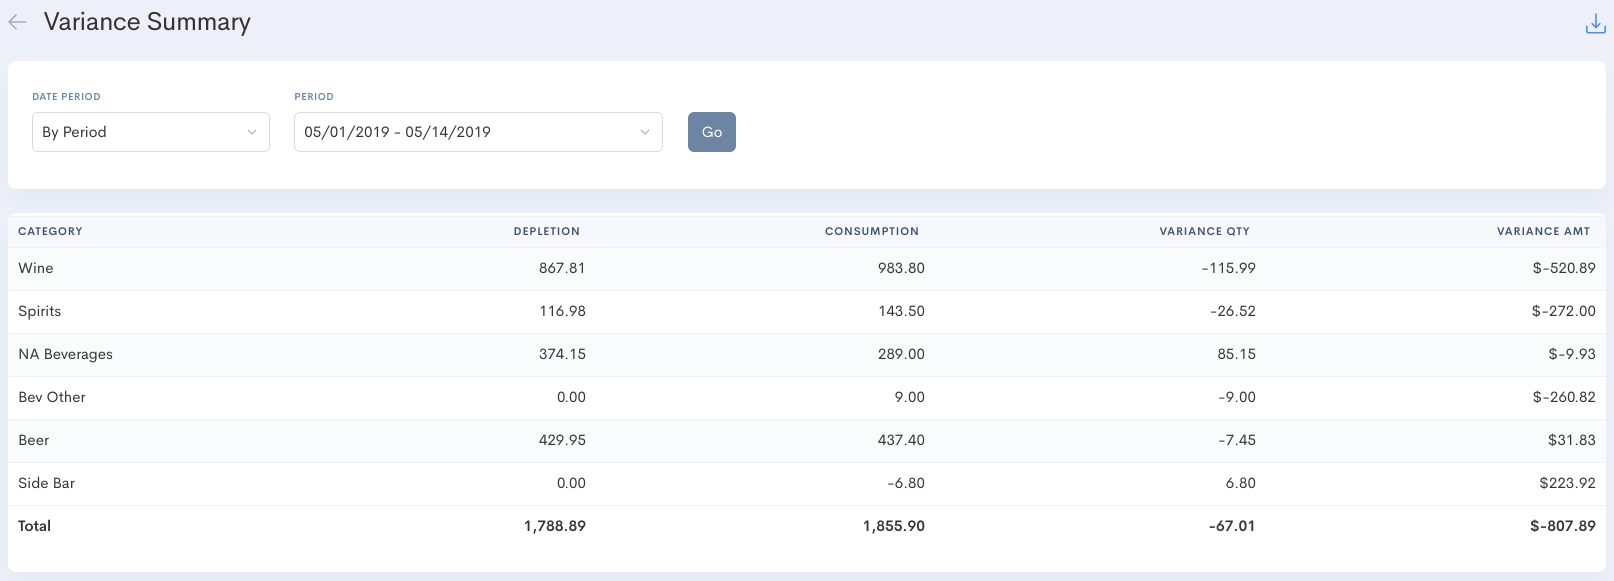
- Filter by Period/Date.
- Click Go to view the results.
Some things to keep in mind
- Each column in the report can be clicked on to reorganize the data.
For example, you can click on End to see in descending order which Categories you have the most stock of at the end of the viewed Date Range. - Export the data in this report to Excel by clicking the download button in the upper right.
- The report will default to pulling data by Period (time between audits).
If you do not see the desired results initially, try filtering By Date. - Categories with a low Variance Quantity but high Variance Amount may be an indication that certain CU Prices are inflated incorrectly. See Variance Details Report under Reports List > Inventory for more information.
Column Key
Category: Name of Category
Depletion: Total quantity of Category Items depleted
Consumption: Total quantity of Category Items consumed
Variance Qty: Quantity discrepancy between depleted and consumed Category Items
Variance Amt: The $ value discrepancy between depleted and consumed Category Items