
Overview
Instead of relying on a single formula or a manual spreadsheet, Forecast AI blends the following in order to best fit each store's patterns, giving operators a dependable forecast of which they can plan labor, ordering, and cash flow:
-
Time-series models
-
Gradient-boosted machine learning neural networks
-
Holiday/event-aware calendar features against up to five years of your historical Point of Sale (POS) sales data.
How Forecast AI builds your forecast
Forecast AI looks back across up to five years of a location's POS sales history and tests that data against multiple forecasting models. Because sales patterns differ by concept, seasonality, and revenue center, Forecast AI doesn't force every location into the same model — it selects whichever model, or combination of models, produces the most reliable prediction for that specific data set.
The result is an average forecast accuracy above 93% for restaurants with sufficient historical POS data. Locations with a shorter sales history, inconsistent POS data, or highly irregular sales patterns may see somewhat lower accuracy, since the models have less reliable history to learn from.
Forecast AI quick guide
In order to access Forecast AI, navigate to the Analytics platform. In the left-hand navigation menu, under Craftable Intelligence, you'll see Forecast AI as an option. After selecting it, Forecast AI is organized into several components, each described below.
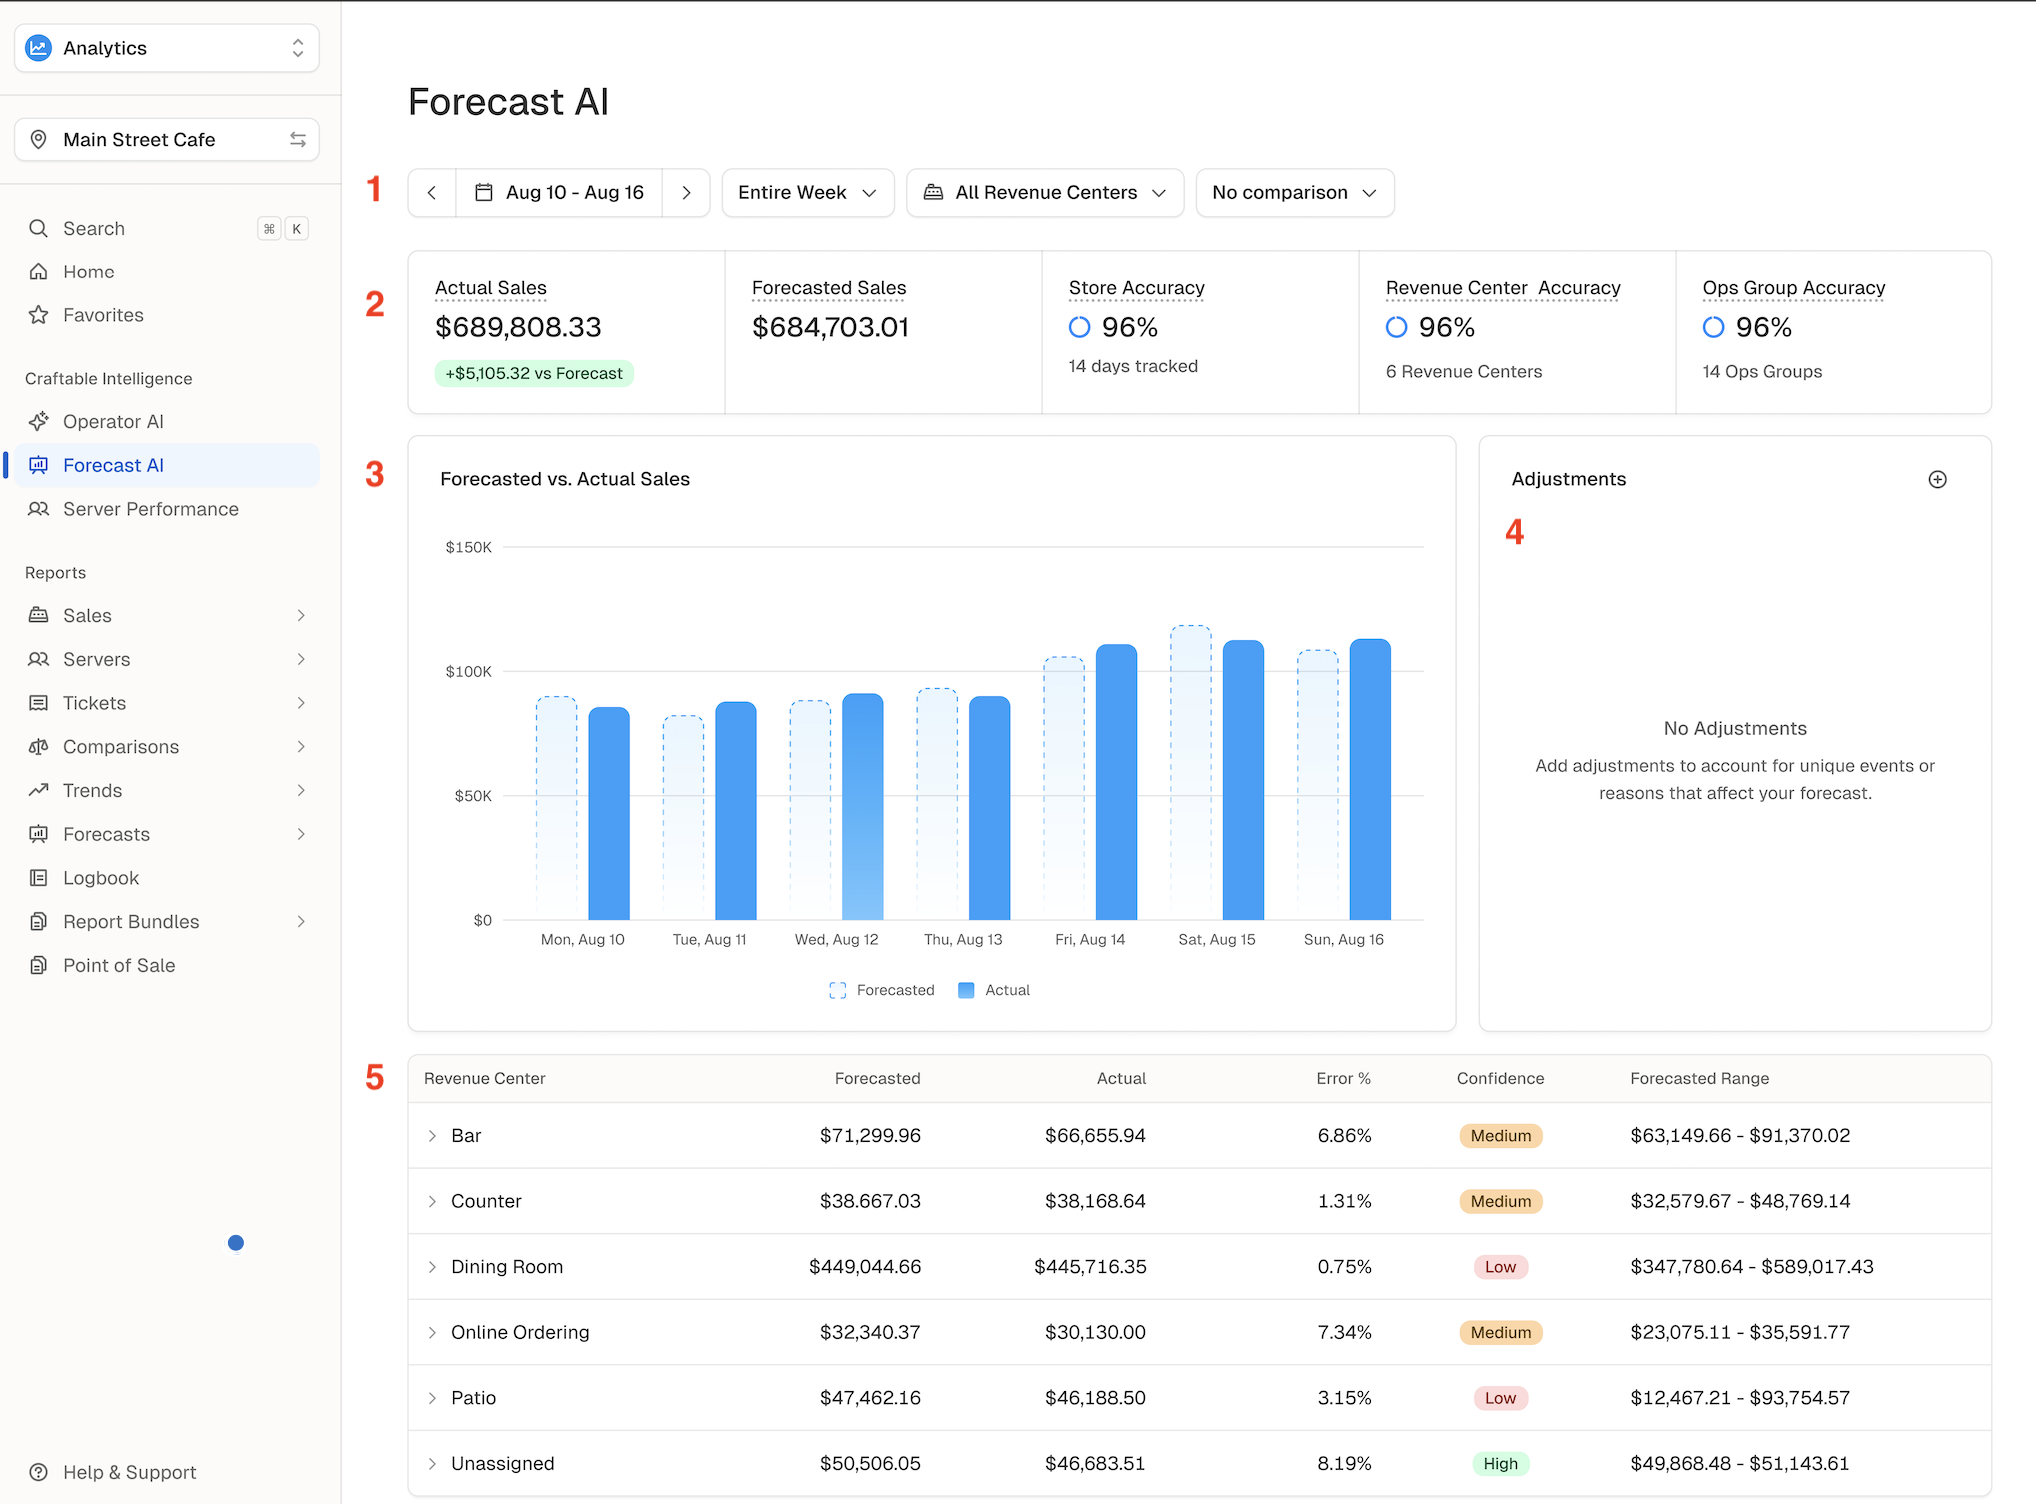
1. Filters
The filters panel at the top of the page controls what the rest of the page displays:

- Week selector – choose the week you want to view
- Day selector – narrow the view to a single day within the selected week, if needed
- Revenue Center selector – restrict data to one or more specific revenue centers
- Set to “All Revenue Centers” by default
- Look Back comparison – compare the selected week against the Previous Week, the Same Week Last Month, or the Same Week Last Year
- Set to “No Comparison” by default
2. Stat tiles
Just below the filters, five stat tiles summarize the selected period:

- Actual Sales – sales recorded for the selected period
- Forecasted Sales – what Forecast AI predicted for that same period
- Forecast Accuracy – how close the forecast came to actual sales, shown as a percentage and broken out by Store, Revenue Center, and Ops Group. These tiles will show “—” for periods that haven't occurred yet, since accuracy can only be calculated once actual sales are known.
- Store: forecast % to actual at the store level
- Revenue Center: forecast % to actual, median of deviation across all revenue centers
- Ops Group: forecast % to actual, median of deviation across all ops groups
3. Forecasted vs. Actual Sales chart
This chart plots each day of the selected week as a pair of bars: forecasted sales in light blue and actual sales in deep blue.
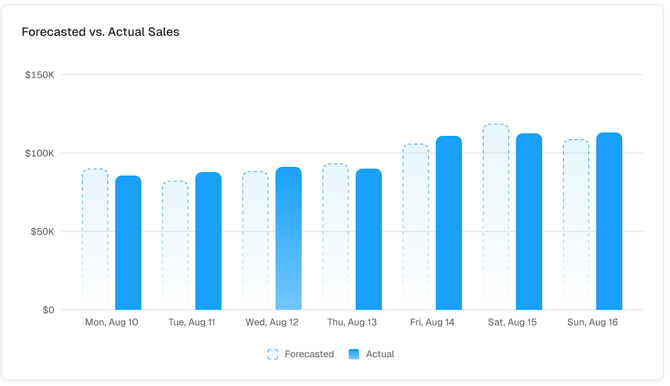
- Hovering over a specific column will display that specific day's forecasted and actual sales (relative to any filters currently applied)
- Clicking on a specific day's column will update stat tiles and the revenue center breakdown to reflect only that day's forecast & actual (vs the full week)
4. Adjustments
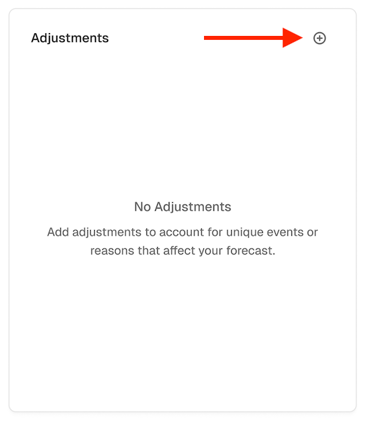
Forecast AI is built to model against historical patterns, meaning one-off deviations from standard (ie; a scheduled closure) can impact forecast accuracy. The Adjustments panel allows the user to inform Forecast AI of these deviations ahead of time so it can account for them. To add an adjustment, click on the plus sign to the right of Adjustments:
A modal will appear in the center of the page. Select the Day(s) of the week the adjustment applies to, followed by which Revenue Center(s) are impacted, select an Adjustment Reason, and notate the Amount of the adjustment (in Dollars or Percentages). If you wish to leave any Additional Details to further describe the adjustment, that is also an option. Finalize by clicking the blue Save Adjustment button.
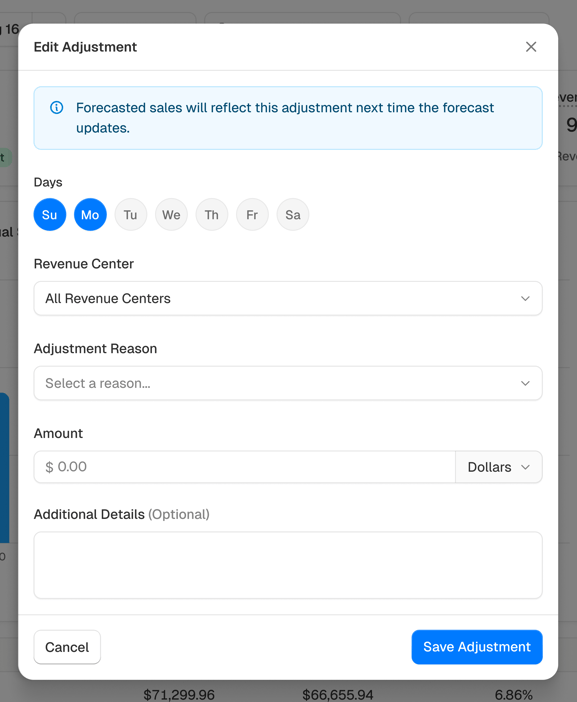
Adjustments are not applied to a forecast retroactively; however, the subsequent forecasts will reflect the adjustment in their modeling, so it's best to add known events as far in advance as possible.
5. Revenue center breakdown
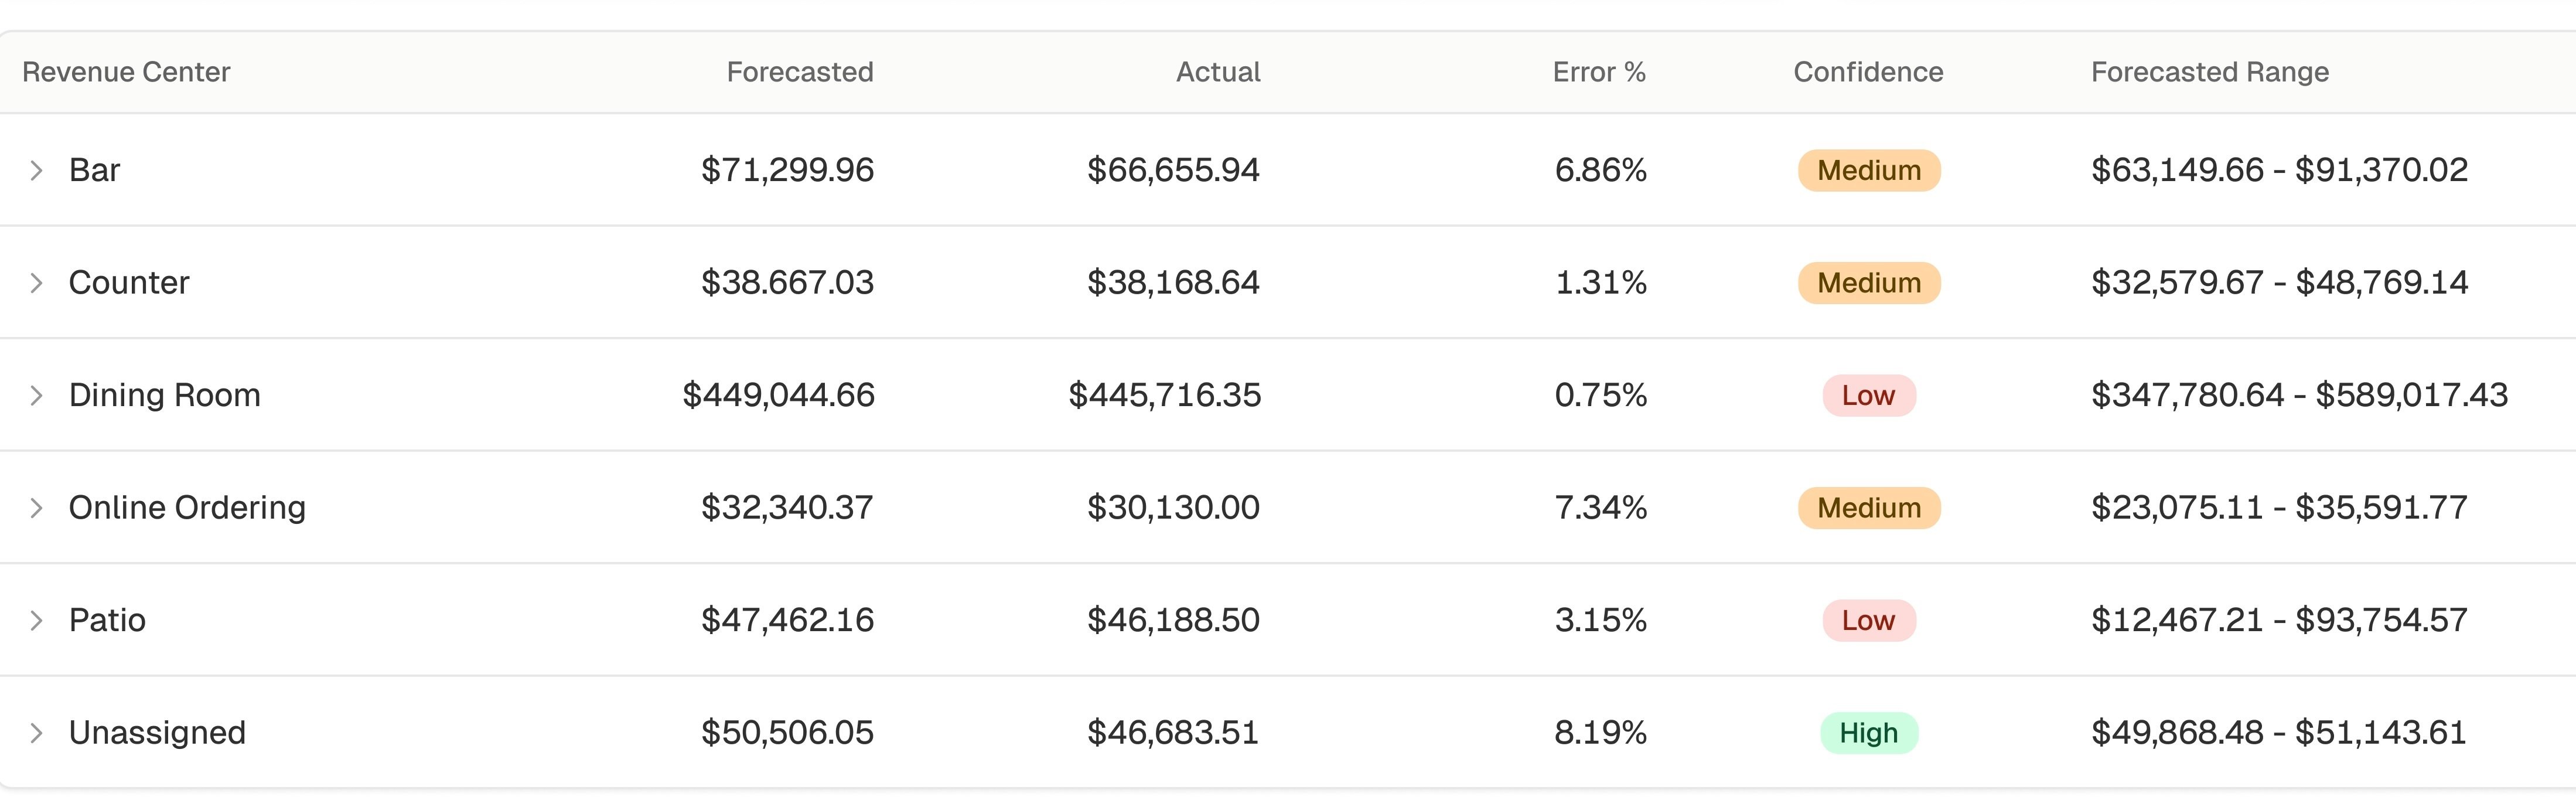
Located beneath the Forecasted vs. Actual Sales chart is a breakdown of forecasted and actual sales at the individual revenue center level (ie; Dining Room, Bar, etc.), along with the percentage variance between the two.
Below is additional information regarding each of the columns in the table:
- Revenue Center: the distinct POS center for which the row will display forecasted vs. actual sales
- Forecasted: the forecasted sales for that revenue center over the specified time period
- Actual: the actual sales for that revenue center over the specified time period (as is available - subject to POS delays)
- Error %: deviation of forecast from actual - this is displayed as an absolute number, meaning if a forecast is 98% below or 102% above actual, the error % will display the same: 2%
- Confidence: the variability and width of forecast ranges—driven by event or weather volatility
- Forecasted Range: the floor and ceiling of our model's forecast, providing insight into understanding the model's estimated worst and best case scenarios depending on the variables it encountered when building its forecast
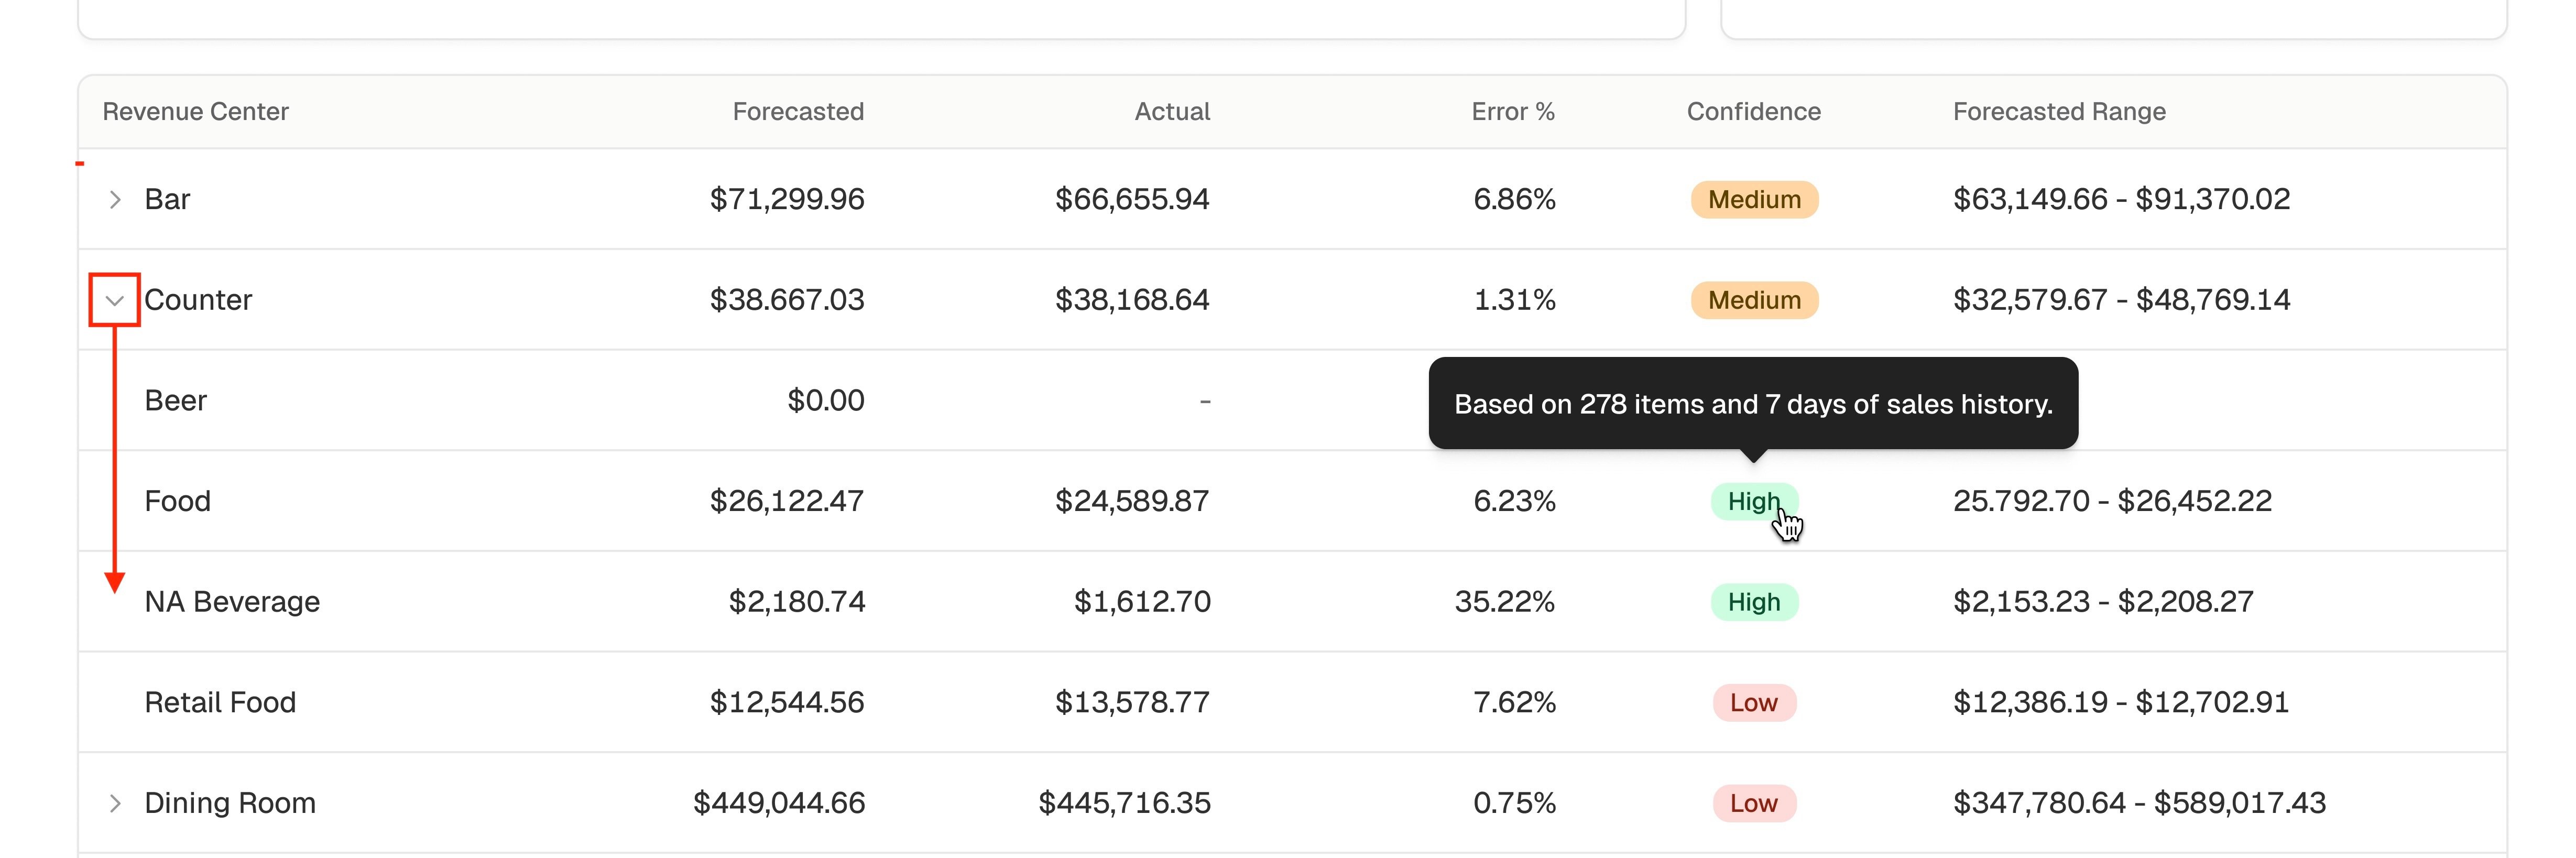
Expanding a revenue center (by clicking the arrow to the left of the Revenue Center) will show a breakout of each ops group component that make up the total revenue across the revenue center. Hovering over the confidence level also gives additional detail about why that confidence rating was chosen, as well as what went into the rating:
Getting the most accurate forecast
Forecast AI's accuracy depends heavily on the quality and depth of the POS data behind it. To get the most reliable forecasts:
- Keep POS integrations connected and syncing consistently. Gaps or outages in POS data reduce the historical signal the models can learn from.
- Ensure all recipes are mapped to POS sales items in your store setup. See this article for step-by-step instructions of how to do this!
- Log known one-time events as Adjustments as soon as they're known, rather than waiting until after the fact.
Frequently Asked Questions (FAQ)
Why does Forecast Accuracy show “—”?
- Accuracy can only be calculated after a period's actual sales are recorded. For future or in-progress periods, this field will be blank until the day or week is complete.
How current is the data on this page?
- The page displays a “Last refreshed” timestamp near the top so you always know how recent the forecast and actuals are. Actual sales figures are limited to the previous day.
What if my location doesn't have years of sales history?
- Forecast AI uses as much historical data as is available, up to five years. Newer locations or those with limited POS history will still receive a forecast, though accuracy is known to improve the greater the amount of POS sales history available.
- Six months of POS history is a hard requirement; after that, the more the better.